
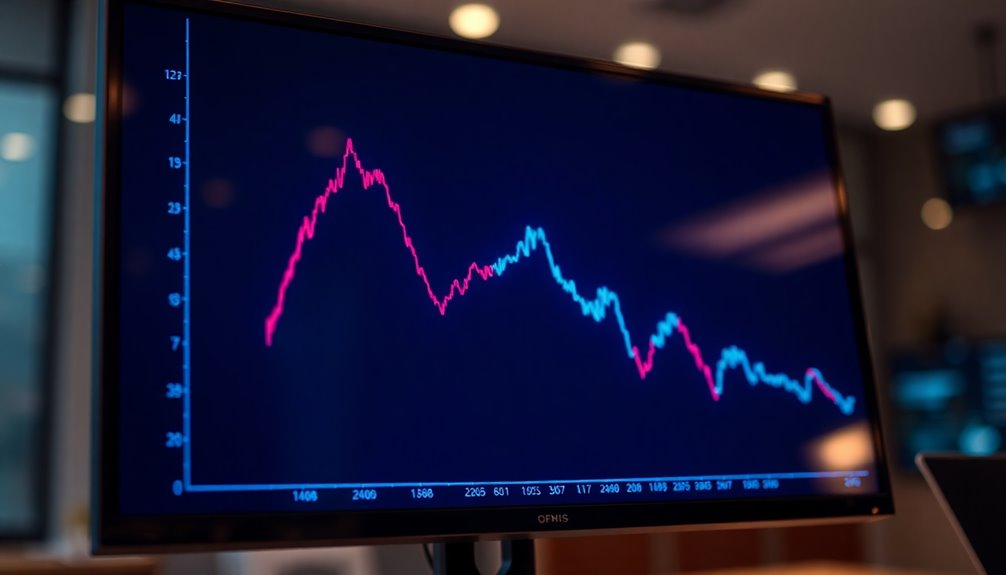
A Death Cross is an important trading signal that occurs when the 50-day moving average drops below the 200-day moving average. This crossover suggests a possible shift from a bull market to a bear market, indicating potential price declines. Historically, it precedes significant downturns, prompting increased selling pressure. While the Death Cross can be a reliable indicator, it's important to combine it with other technical analysis tools to confirm trends. Many traders pay close attention to this signal to adjust their strategies. There's more to understand about its implications and behavior in the markets if you keep exploring.
Key Takeaways
- A Death Cross occurs when the 50-day moving average crosses below the 200-day moving average, indicating potential bearish market conditions.
- It often signals a shift from a bull market to a bear market and can precede significant downturns.
- Historically, about 60% of the time, a Death Cross leads to price declines in the market.
- The indicator is a lagging signal, confirming trends rather than predicting future movements and is more reliable with additional technical indicators.
- While it indicates increasing selling pressure, markets may rebound after the cross, showing gains in the year following the event.
Key Features of Death Cross

One key feature of the Death Cross is its definition: it happens when the 50-day moving average crosses below the 200-day moving average. This crossover often signals a potential shift from a bull market to a bear market.
Historically, the Death Cross has preceded significant market downturns, making it a crucial lagging indicator for traders. You'll find that it typically generates sell signals, prompting increased selling pressure and rapid price declines.
As market sentiment shifts towards fear and caution, the effectiveness of the Death Cross can be amplified when supported by other technical indicators, like high trading volume or momentum indicators such as MACD.
Understanding these features helps you navigate potential market challenges more effectively.
Defining the Death Cross Concept

Understanding the concept of the Death Cross is essential for anyone navigating the stock market, especially during turbulent times.
The Death Cross is a technical analysis chart pattern that occurs when a short-term moving average, like the 50-day, crosses below a long-term moving average, typically the 200-day. This signals potential bearish market conditions and often precedes significant market downturns.
As a lagging indicator, it confirms trends rather than predicts them, creating sell opportunities in a declining market. You can enhance its reliability by combining it with momentum indicators and trading volume analysis.
Despite its negative implications, the Death Cross can also lead to rebounds, as savvy investors may seize oversold conditions for potential gains in the following months.
Moving Averages Signal Trend Reversals

When a short-term moving average crosses below a long-term moving average, it often signals a significant trend reversal in the market. This event, known as the death cross, typically indicates the start of a bearish trend.
Traders pay close attention to these moving averages, especially during periods of increased trading volume, as it suggests stronger selling pressure. Historical instances of the death cross have been linked to major market downturns, like the 2008 financial crisis.
However, it's important to note that while the death cross can predict price declines, about two-thirds of the time, the S&P 500 experiences gains within a year.
Combining this signal with other technical indicators and momentum analysis can enhance its reliability.
Pros and Cons Overview

The Death Cross presents both advantages and drawbacks for traders. On one hand, it signals potential bearish market sentiment through a moving average crossover, often indicating negative price movements. Historically, traders have seen this pattern correlate with downturns, making it a valuable tool for anticipating market shifts.
However, about 60% of the time, the Death Cross leads to declines, and its effectiveness can wane in volatile markets, resulting in false signals. To enhance reliability, confirmation from additional technical indicators, like volume analysis and momentum indicators, is crucial.
While the S&P 500 has shown gains after a year despite initial declines, traders must weigh the risks and benefits carefully when interpreting this signal.
Golden Cross Versus Death Cross

While both the Golden Cross and Death Cross utilize the same moving averages, they convey vastly different market sentiments.
A Death Cross occurs when the 50-day moving average crosses below the 200-day moving average, signaling a potential bearish trend and increasing selling pressure. Historically, this pattern has been linked to significant market downturns, like the 2008 financial crisis.
In contrast, a Golden Cross happens when the 50-day moving average crosses above the 200-day, indicating a bullish trend and buying strength. This pattern often leads to positive price movements and suggests recovery.
Both serve as lagging indicators that can influence your trading decisions in the stock market, reflecting opposite expectations for future prices.
Market Volatility Implications

As market sentiment shifts following a Death Cross, you might notice an uptick in volatility that reflects traders' reactions to the bearish outlook.
Historical data shows that after a Death Cross, increased selling pressure often leads to significant price fluctuations. This heightened market volatility can trigger a rise in short-selling activity, as traders anticipate continued downward momentum.
Consequently, you may find that trading strategies need to adapt, emphasizing cautious trading to mitigate risks. The implications of a Death Cross can cause fear and uncertainty, potentially creating a cascade effect that drives further declines.
Studies indicate that markets might experience above-average volatility in the year following a Death Cross, highlighting the importance of staying vigilant during these turbulent times.
Recent Market Behavior Analysis

Amid shifting market dynamics, recent behavior following Death Cross events reveals a nuanced landscape that challenges conventional bearish assumptions.
Historically, the Death Cross, marked by the 50-day moving average crossing below the 200-day moving average, signaled bearish market sentiment.
However, analysis shows that the S&P 500 gained an average of 6.3% one year later, suggesting immediate declines aren't always prolonged.
In the Nasdaq Composite, average returns post-Death Cross were 2.6% (1 month), 7.2% (3 months), and 12.4% (6 months).
Notably, the Death Cross tends to have enhanced predictive reliability after a market correction of at least 20%.
Ultimately, market conditions can significantly influence these outcomes, leading to unexpected gains despite initial bearish trends.
Monitor Volume for Confirmation
When assessing a Death Cross, monitoring trading volume is essential for confirming the signal's validity. High trading volume indicates strong selling pressure, reinforcing the bearish signal associated with this technical indicator.
If you notice a Death Cross accompanied by low trading volume, it might suggest a weak trend change, leading to potentially false signals. Analysts often look for an increase in volume during the crossover to validate the downward trend's strength.
Historical data shows significant price movements following a Death Cross often correlate with increased trading volume, which helps in understanding market momentum.
Always consider volume alongside other technical indicators to gain essential context for interpreting the Death Cross and assessing future price movements effectively.
Frequently Asked Questions
Is Death Cross Good or Bad?
Whether a Death Cross is good or bad depends on your perspective and strategy. It often signals potential market weakness, which might prompt you to sell or reassess your investments.
However, it can also create buying opportunities if you spot undervalued assets.
Remember, it's essential to use other indicators to confirm trends, as the Death Cross isn't always a reliable predictor of future performance.
What Happens After a Death Cross?
After a Death Cross, you might notice the market's initial bearish behavior, but don't be too quick to panic.
Historically, the S&P 500 often gains around 6.3% within a year, and the Nasdaq shows positive returns in the following months. This pattern suggests potential recovery, so keep an eye on market conditions and other indicators.
Stronger investors may seize this opportunity, leading to rebounds despite the initial downturn.
What Is the Cross of the Dead?
The phrase "cross of the dead" can evoke various interpretations, often linked to themes of mortality and transition.
You might think of it as a metaphor for change, representing a pivotal moment in life where one chapter ends and another begins.
This concept can also resonate with spiritual beliefs, symbolizing a connection between the living and the deceased.
Ultimately, it's about embracing transformation and understanding the cycles of existence.
What Is the Death Cross in Bitcoin?
When you notice a certain trend in Bitcoin's price movements, it's crucial to pay attention.
A significant bearish signal arises when the shorter-term moving average dips below the longer-term one. This crossover often hints at increased selling pressure and potential declines in value.
If you see this pattern, it might be time to reassess your strategy, as historical data suggests it could lead to further price drops in the coming months.
Conclusion
In summary, understanding the death cross is crucial for navigating market trends. By recognizing the signals from moving averages, you can better anticipate potential reversals and manage your investments effectively. Keep in mind the pros and cons, as well as the contrasting golden cross, to make informed decisions. Stay alert to market volatility and monitor trading volume for confirmation, ensuring you're prepared to act when the time comes. Knowledge is your best tool in the trading game!