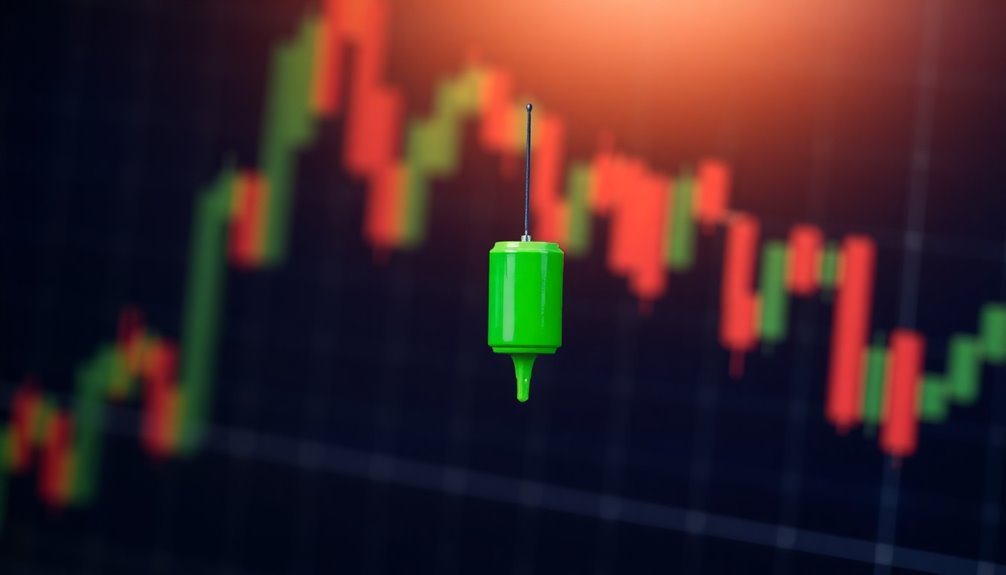
A hammer candlestick is a crucial indicator in trading that signals a potential bullish reversal after a downtrend. You can identify it by its distinct shape, featuring a small body at the top and a long lower shadow, which should be at least twice the body length. This pattern shows that buyers pushed prices back up after sellers initially drove them down. However, to validate the signal, the next candlestick must close above the hammer's closing price. If you're curious about enhancing your trading strategy, there's plenty more to explore around this pattern and its effective application.
Key Takeaways
- A hammer candlestick has a small body at the upper end and a long lower shadow, indicating potential bullish reversal.
- The long lower shadow should be at least twice the length of the body, showcasing strong buying pressure after a decline.
- This pattern is most significant when it appears after downtrends and at established support levels.
- Confirmation is required; the next candlestick must close above the hammer's closing price to validate the signal.
- Combining the hammer pattern with other technical indicators can enhance trading strategies and reduce risks.
Key Features of Hammer Candlestick

A hammer candlestick stands out in the world of technical analysis due to its distinct shape and implications. This pattern typically appears at the bottom of a downtrend, signaling a potential reversal.
You'll notice it has a small body located at the upper end of the trading range, accompanied by a long lower shadow that's at least twice the body's length. The minimal or nonexistent upper shadow reinforces the bullish sentiment, suggesting that buying pressure is starting to outweigh selling pressure.
While the color of the body—green or red—matters less, a longer lower shadow indicates stronger buying pressure. Confirmation of this pattern usually comes from the next candlestick closing above the hammer's closing price, validating the reversal signal.
Candlestick Pattern Overview

While understanding candlestick patterns can seem daunting at first, they provide valuable insights into market behavior.
The hammer candlestick pattern is a bullish reversal pattern typically found at the bottom of downtrends. It features a small body at the upper end of the trading range, with a long lower shadow indicating that sellers initially drove the price down. However, strong buying pressure pushed the price back up, closing near the opening price, signaling a shift in market sentiment.
To confirm this pattern, look for a confirmation candle that closes above the hammer's closing price. The pattern's reliability increases at key support levels and with other technical indicators, but be cautious of false signals and incorporate it within a broader trading strategy.
Price Reversal Indication

Understanding price reversal indications is crucial for traders looking to capitalize on market shifts. A hammer candlestick is a bullish reversal pattern that appears after a downtrend, signaling potential market capitulation and the start of a price increase.
This pattern features a small body at the upper end of the trading range and a long lower shadow, which represents significant buying pressure after a decline. For confirmation of the price reversal, the next candlestick needs to close above the hammer's closing price.
The hammer's significance increases when it forms at established support levels, indicating that buyers are absorbing selling pressure. To enhance your strategy, consider using additional technical indicators to confirm the anticipated reversal following the hammer formation.
Pros and Cons of Usage
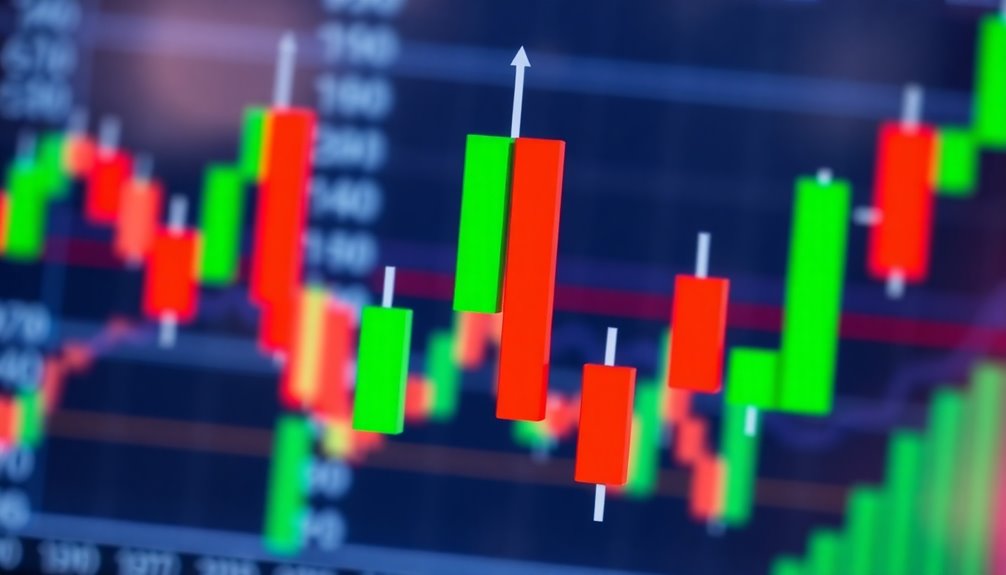
Using the hammer candlestick pattern can be a double-edged sword for traders. On one hand, it signals a potential bullish reversal, showing that buyers are absorbing selling pressure after a decline.
Longer lower shadows, ideally 2-3 times the body length, can indicate stronger buying interest. However, relying solely on this pattern can lead to potential losses if the market shifts unexpectedly.
Confirmation from subsequent candles is crucial to validate the reversal, as false signals can mislead your trading strategy.
To enhance your decisions, consider using the hammer candlestick alongside other technical indicators. This approach can help you navigate market volatility and reduce risks, ensuring you're better prepared to capitalize on buying interest when it arises.
Hammer vs. Shooting Star
The hammer and shooting star candlestick patterns are both significant indicators, but they serve opposite purposes in trading.
A hammer forms after a downtrend, featuring a long lower shadow that suggests bullish reversal potential, indicating buying pressure that rejects further downside.
In contrast, the shooting star appears after an uptrend, characterized by a long upper shadow and a small body, signaling potential bearish reversal due to selling pressure that rejects further upside.
For a hammer to be valid, confirmation is needed from the next candle closing higher, while a shooting star requires the following candle to close lower.
Understanding these patterns is crucial, as a hammer indicates a market bottom, whereas a shooting star signals a market top.
Market Volatility Impacts Reliability

While market volatility can create exciting trading opportunities, it also complicates the reliability of hammer candlestick patterns. In choppy or sideways markets, you might find hammer patterns offering unclear signals for trend reversals, making them less effective.
High volatility typically leads to larger price movements, which can result in false signals and premature entries. To enhance the reliability of your trades, consider waiting for a confirmation candle following a hammer pattern. This can help establish clearer entry and exit points, especially when combined with other technical indicators.
Recent Market Behavior Insights

Recent market behavior has highlighted a notable increase in hammer candlestick formations, particularly at key support levels.
In the last quarter of 2023, you might've noticed these hammer candlesticks signaling potential bullish reversals after extended price declines. This trend aligns with upward price movements across various asset classes, including currency pairs.
High trading volume during recent market rallies further emphasizes the significance of these patterns, indicating strong buying pressure.
As sentiment shifts towards optimism, traders often look for confirmation candles following hammer formations to validate their strategies.
The effectiveness of these patterns has been evident, reinforcing the idea that recognizing hammer candlesticks can enhance your trading decisions in today's dynamic market landscape.
Use Volume for Confirmation

When you spot a hammer candlestick, it's essential to consider the accompanying volume for a clearer picture of market sentiment. Higher volume during the hammer formation indicates stronger buying interest, which increases the likelihood of a bullish reversal.
If you see a hammer formed with a significant volume spike, it suggests that buying pressure can absorb selling pressure, reinforcing your reversal signal. Conversely, low volume can indicate high risk, as it may reveal a lack of conviction among buyers, leading to a false reversal.
Always look for volume trends alongside the hammer pattern to enhance your trading strategies and improve the reliability of your entry points. This careful analysis can help you make more informed trading decisions.
Frequently Asked Questions
What Does a Hammer Candlestick Indicate?
A hammer candlestick indicates a potential bullish reversal, signaling that buyers might be gaining strength after a downtrend.
You'll notice a long lower shadow and a small body at the top of the trading range, suggesting strong buying pressure following a price drop.
If this pattern forms at a key support level, it's especially significant.
Watch for confirmation when the next candle closes above the hammer's closing price to consider a long trade.
Can a Hammer Candle Be Bearish?
Yes, a hammer candle can be bearish, but it depends on the context.
If it appears after an uptrend, it might signal a potential reversal, resembling a shooting star. This indicates market hesitation and a possible rejection of higher prices.
However, it's crucial to wait for confirmation from the next candlesticks before making any assumptions. Just seeing a hammer doesn't guarantee a trend change; context and follow-up actions matter significantly.
Is Red Hammer Candle Bullish?
A red hammer candle can be seen as somewhat bullish, but it's less convincing than a green hammer. It shows that buyers are starting to reject lower prices, despite closing lower than it opened.
If you spot it after a downtrend, it's a sign that sellers may be losing momentum. To strengthen your analysis, look for confirmation from the next candle closing above the red hammer's close. That'll help validate the potential reversal.
Is a Hammer Candlestick Good or Bad?
A hammer candlestick can be a good signal, especially if it appears after a downtrend. It suggests that buyers are stepping in, rejecting lower prices.
However, you shouldn't rely on it alone; confirmation from the next candlestick is key. If that candle closes above the hammer, it strengthens the bullish case.
Just remember, market conditions can affect its reliability, so always consider other indicators before making any trades.
Conclusion
In conclusion, the hammer candlestick is a powerful tool for traders looking to identify potential price reversals. By understanding its key features and how it compares to patterns like the shooting star, you can make more informed decisions. Remember to consider market volatility and use volume as confirmation to enhance reliability. With practice, you'll be better equipped to spot these patterns and leverage them in your trading strategy, ultimately improving your chances of success.
